With the huge amount and variety of available, open source monitoring tools, it’s easier than ever before to collect, store, visualise and analyse data of a target system. Though most of those tools are mainly used for performance monitoring purposes, in general, they are domain-agnostic. For Prometheus or Grafana there is no difference whether they are collecting and visualising a response time metric or a metric describing the revenue of an online shop. As those tools are already in place in many companies, why not use them for business observability?
Detecting early that the load of an IT system has dropped is extremely important. But wouldn’t it be even more important and of crucial interest to see how this affects revenue, profit, etc.?
In this blog post, we will show you how easy it is to gather and visualise business metrics from your target Java-based system without the need to touch the application’s code – even without the need to restart your application. All we need for this are just a few powerful, open source monitoring components including inspectIT Ocelot, Prometheus and Grafana.
What’s ‘The Business’ We Want to Monitor?
In this blog post, our target system is the blueprint application “HeatClinic” of the open source e-commerce system Broadleaf. HeatClinic is an online shop for hot sauces with fancy names like ‘Armageddon – The Hot Sauce To End All’ … yummy.
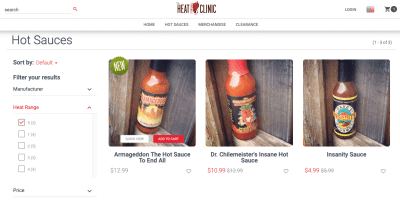
The hot sauces are categorised into heat ranges indicating how spicy they are. And of course each sauce has a manufacturer and a price. Given these three simple characteristics, you already may think of many different questions that would be of interest from the business perspective:
- What are the most popular manufacturers?
- Which heat ranges generate the biggest revenue?
- How does the price affect the sales numbers?
- … and so on …
With the right tools answering such questions is quite easy! Let’s have a look what we need for this…
The Open Source Monitoring Tools
To answer the questions mentioned above, we need to gather, store and display data from the HeatClinic application. Among the great variety of alternatives, in our example scenario we use the following tools:
- inspectIT Ocelot: inspectIT Ocelot is a flexible and powerful Java agent for extracting monitoring data (such as metrics and traces) from Java-based systems. inspectIT allows you to specify data collection fully through configuration without the need to touch the source code of the target application. You don’t even need to restart the target application. As inspectIT Ocelot is using the OpenCensus standard for instrumentation, the gathered data can be consumed by many different monitoring tools.
- Prometheus: Prometheus is a widespread tool for collecting, storing and querying metric data. We will use prometheus as our backend for the metric data.
- Grafana: Grafana is an extremely flexible and powerful tool for creating dashboards based on metric data. We will use Grafana to create a nice-looking, expressive business dashboard.
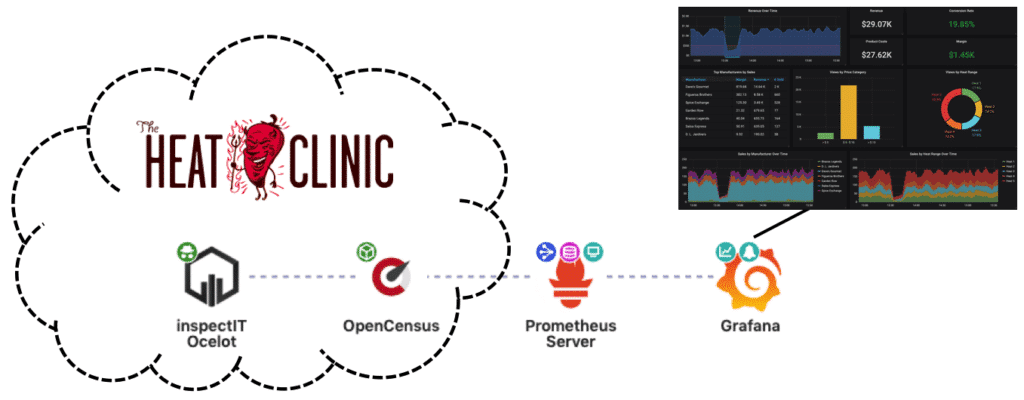
All in all, the monitoring landscape looks as depicted below. inspectIT Ocelot runs as a Java agent in the JVM of the HeatClinic. Based on the configuration (which we will explain in the following), the agent injects OpenCensus-based instrumentation into the application. Prometheus scrapes the metrics exposed by inspectIT Ocelot and provides them to Grafana for visualisation purposes.
Gathering the Data
Let’s have a look on how to specify what kind of data we want to gather from the target application. In the current version, inspectIT allows to configure its agents by means of simple YAML files.
Let’s consider the first question of interest mentioned above:
What are the most popular manufacturers?
To answer this question we need the number of views and value of products broken down by manufacturers. So we first have to define the corresponding metric types:
inspectit:
  metrics:
    definitions:
      '[product/views_price]':                        # name of the metric
        unit: dollars
        description: "The price of viewed products."
        views:
          '[product/view_price/sum]':                 # aggregation for the metric
            aggregation: SUM
            tags:
              manufacturer: true                      # grouping /breaking down by manufacturer
          '[product/view_price/count]':               # aggregation for the metric
            aggregation: COUNT
            tags:
              manufacturer: true                      # grouping /breaking down by manufacturer
With this we defined a metric product/views_price with the two aggregations SUM and COUNT and tagged by the manufacturer. Now, we need to specify where we want to extract the metric from. In the Broadleaf application the class BroadleafProductController handles the user requests related to product visits. Therefore, we use the concept of scopes in the inspectIT Ocelot configuration:
inspectit:
  instrumentation:
    scopes:
      product_view_scope:
        type:
          name: org.broadleafcommerce.core.web.controller.catalog.BroadleafProductController
        methods:
          - name: handleRequest
With this configuration we defined a new instrumentation scope called product_view_scope that covers the handleRequest method of the BroadleafProductController class. Having the metric and the location where to extract data, we need to tell inspecIT Ocelot what data to extract. In our example we want to extract the price of the products that are visited by the end-users. The Product object with the corresponding price information is attached to the ServletRequest as an attribute. We can use Java syntax in the data provider definitions within the inspectIT Ocelot configuration to specify the extraction and transformation of data:
inspectit:
  instrumentation:
    data-providers:
      price_provider:
        imports:
          - javax.servlet
          - org.broadleafcommerce.core.catalog.domain
        input:
          _arg0: ServletRequest
        value-body: |
          Product product = (Product)_arg0.getAttribute("currentProduct");
          if(product != null){
            return new Double(product.getDefaultSku().getRetailPrice().getAmount().doubleValue());
          }
          return null;
This data provider basically extracts the price from the visited Product and returns the double value. Finally, we need to bring the puzzle pieces (metric, scope and data-provider) together as an instrumentation rule:
inspectit:
  instrumentation:
    rules:
      price_views:
        scopes:
          product_view_scope: true
        entry:
          price:
            provider: price_provider
        metrics:
          '[product/view_price]': price
Here we tell the inspectIT Ocelot agent that it should use the price_provider to extract the price in the entry of the method defined in the product_view_scope and append the value to the product/view_price metric.
Using this piece of configuration and the agent attaching mechanism we get a business metric without touching the source code and without restarting the target application. In a similar way other metrics can be extracted. Visit the inspectIT Ocelot documentation to see all the possibilities to configure the agent and flexibly extract data.
Let’s See What We Can Do With the Data …
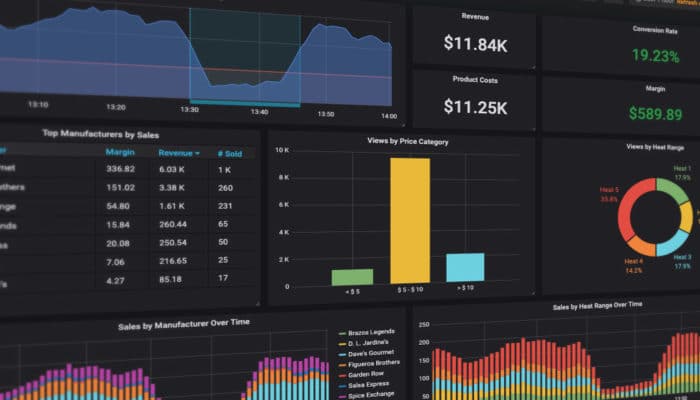
Now that we have extracted business metrics, let’s use Grafana to build expressive business dashboards. Since in our example we chose Prometheus as the data backend, we use the Grafana Prometheus datasource to retrieve the metric data using the Prometheus Query Language (PromQL). By using and configuring different Grafana panels we get the following dashboard from our collected data:
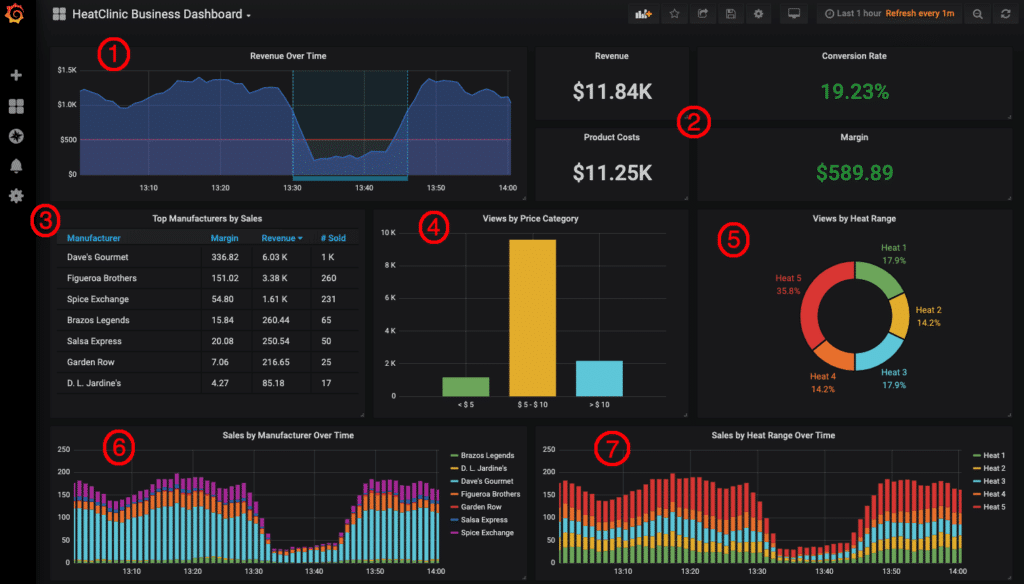
The dashboard shows the following information:
- The revenue of the HeatClinic over time. Wouldn’t it be nice to be alerted on the revenue drop at 13:30?
- The overall revenue, product costs, conversion rate and margin for the selected time range.
- The manufacturers with their margin, revenue and number of sold products.
- The number of views broken down by price category.
- The number of views broken down by the heat range of the sauces. Seems like in our scenario people like the very, very spicy sauces (heat range 5) more than others.
- Number of sales over time broken down by manufacturer.
- Number of sales over time broken down by heat range.
Isn’t that a lot of business related information just by writing a few lines of YAML configuration? Now, you can do with the information what ever you like: alerting on pattern changes, customer behaviour analysis, etc.
Conclusion
That’s it! In this blog post we showed the possibilities of using open source monitoring tools for the purpose of collecting and analysing business-related data. Enriching your monitoring data with business metrics can provide a great additional value for different types of stakeholders. Take advantage of the flexibility of open source monitoring tools!
What is your experience with collecting business metrics?
Do you want to discuss similar scenarios, or do you have any questions regarding this or similar topics?
Get in touch with us via mail – info@novatec-gmbh.de !