This is one in a small series of blog posts about Kubernetes Service Meshes, please check there for reference. While the previous post started out by introducing the general picture and the basic concepts, here I will deal with a specific implementation and its respective details.
Much of the contents presented here will be covered in more detail as part of the Novatec training “Docker und Kubernetes in der Praxis”. And of course all shown technologies have more features than merely those presented here, where I will only provide a glimpse into them.
eBPF
I’ll first briefly talk about eBPF, a technology utilized by Cilium, as that is the differentiating factor when compared to classical Service Meshes as I will further show below.
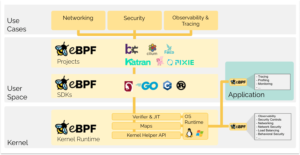
The extended Berkeley Packet Filter (eBPF) allows one to load and run custom programs sandboxed with the Linux Kernel to extend or modify the way the kernel behaves, and it is thus ideally suited to dynamically implement observability, security, and networking functionality. Which is just what a Service Mesh strives to do, incidentally.
However, implementing all these on the kernel level saves the user the overhead of plugging Service Mesh functionality individually into their workloads, allowing for a smoother and more encompassing user experience. And thanks to eBPF this implementation can be achieved on the fly, without the need to load additional kernel modules or rewrite the kernel itself, speeding up the implementation.
But of course this interface to the kernel has its limitations concerning the complexity and size of these custom programs to add to the kernel, so while eBPF provides the groundwork to affect the kernel, additional user-space components will be needed to handle further functionality.
Further information about eBPF can also be found in “What is eBPF?” by Liz Rice of Isovalent.
Cilium
Cilium is fully open source, licensed under Apache License 2.0, and is a Cloud Native Computing Foundation incubating project.
Using eBPF as a foundation, Cilium provides both a Container Network Interface (CNI) to be plugged into a Kubernetes cluster, and now also a Service Mesh implementation with user space components interacting with the kernel via eBPF programs. This allows integrating workloads into a Service Mesh without the need for adding sidecar proxies, and thus enables a sidecar-less model.
In addition there is Hubble – a fully distributed networking and security observability platform built on top of Cilium and eBPF.
Isovalent, the original creators of Cilium, offer support, training, and enterprise products around the open-source Cilium tool.
Installation
CLI
As per Cilium Quick Installation I can download the CLI directly, both for Cilium and also for Hubble. At the time of this writing this is version 1.12.13 and 0.11.2, respectively, and thus
$ curl --silent --location https://github.com/cilium/cilium-cli/releases/download/v0.12.13/cilium-linux-amd64.tar.gz | tar --directory=$HOME/bin -xzvpf -
$ curl --silent --location https://github.com/cilium/hubble/releases/download/v0.11.2/hubble-linux-amd64.tar.gz | tar --directory=$HOME/bin -xzvpf -
will serve to install the CLI tools to my local system.
Yes, Cilium v1.13 has just been released, and I’m looking forward to actually test it, but not yet.
Cluster
Using this CLI I can then deploy the Cilium components into a Kubernetes cluster. However, due to Cilium’s use of eBPF that cluster needs to fulfill certain requirements, making brownfield deployments somewhat harder to achieve. For my testing I will use Minikube configured as follows:
minikube start --network-plugin=cni --cni=false --driver=kvm2 --memory=4g --nodes=4
And once this cluster is ready I can start installing Cilium, already with mectrics exposure enabled for later observability:
$ cilium install --helm-set 'prometheus.enabled=true,operator.prometheus.enabled=true'
which might then yield output like the following:
[...]
⌛ Waiting for Cilium to be installed and ready...
✅ Cilium was successfully installed! Run 'cilium status' to view installation health
And I will also activate the Hubble UI with mectrics exposure enabled for later observability and deploy the matching Prometheus & Grafana example setup:
$ cilium hubble enable --ui --helm-set hubble.metrics.enabled="{dns,drop,tcp,flow,port-distribution,icmp,http}"
$ kubectl apply -f https://raw.githubusercontent.com/cilium/cilium/1.12.6/examples/kubernetes/addons/prometheus/monitoring-example.yaml
As indicated above I can display the installation health status, or go under the hood for even more details:
$ cilium status $ kubectl -n kube-system exec ds/cilium -- cilium status
Cilium also provides an extensive self-test for validating that my cluster has proper network connectivity, which can also interface with Hubble:
$ cilium hubble port-forward &
$ cilium connectivity test
which might easily take 15 minutes to finish and which then will yield output like the following:
[...]
✅ All 31 tests (238 actions) successful, 0 tests skipped, 1 scenarios skipped.
Now that the Cilium control plane is running in my cluster I can start integrating workloads.
Integrate workloads
I will now deploy two sample applications that together build a simple todo list. First a backend:
apiVersion: apps/v1
kind: Deployment
metadata:
  name: todobackend
spec:
  replicas: 1
  selector:
    matchLabels:
      app: todobackend
  template:
    metadata:
      name: todobackend
      labels:
        app: todobackend
      annotations:
        io.cilium.proxy-visibility: "<ingress/8080/TCP/HTTP>"
    spec:
      containers:
      - name: todobackend
        env:
        - name: SPRING_PROFILES_ACTIVE
          value: dev
        image: novatec/technologyconsulting-containerexerciseapp-todobackend:v0.1
      restartPolicy: Always
---
apiVersion: v1
kind: Service
metadata:
  name: todobackend
spec:
  type: ClusterIP
  ports:
  - port: 8080
  selector:
    app: todobackend
And then a frontend:
apiVersion: apps/v1
kind: Deployment
metadata:
  name: todoui
spec:
  replicas: 1
  selector:
    matchLabels:
      app: todoui
  template:
    metadata:
      name: todoui
      labels:
        app: todoui
      annotations:
        io.cilium.proxy-visibility: "<egress/53/UDP/DNS>,<ingress/8090/TCP/HTTP>"
    spec:
      containers:
      - name: todoui
        image: novatec/technologyconsulting-containerexerciseapp-todoui:v0.1
      restartPolicy: Always
---
apiVersion: v1
kind: Service
metadata:
  name: todoui
spec:
  type: LoadBalancer
  ports:
  - port: 8090
  selector:
    app: todoui
Please note that I have already added a Cilium-specific Pod annotation io.cilium.proxy-visibility that will help Hubble to understand the traffic.
Examine the meshed workloads
When I now examine the newly-deployed workloads I can check what Cilium might automatically have added:
$ kubectl get po
NAME                           READY   STATUS    RESTARTS   AGE
todobackend-749f77d9c5-tvk8j   1/1     Running   0          1m16s
todoui-55674959d8-xj6tp        1/1     Running   0          1m26s
Huh, no sidecar proxies have been added! So Cilium is not active, or what does this mean? Well, let’s put some load on the deployed todo app, so I issue in a separate command window:
LOADBALANCER_IP="$(kubectl get svc todoui -o jsonpath="{.status.loadBalancer.ingress[0].ip}")"
while sleep 2; do
    curl --silent "http://$LOADBALANCER_IP:8090" | head -n 4
done
Of course feel free to also access the todo app frontend pointing your browser of choice at that URL. What does Cilium know about this traffic now?
Let’s check with Hubble:
$ cilium hubble port-forward & # if not still active from the connectivity test above
$ hubble observe --type l7 -f
and I can see output like the following
Feb 23 14:00:49.408: 10.0.3.251:56632 (world) -> default/todoui-55674959d8-xj6tp:8090 (ID:61266) http-request FORWARDED (HTTP/1.1 GET http://10.107.11.6:8090/)
Feb 23 14:00:49.410: default/todoui-55674959d8-xj6tp:38117 (ID:61266) -> kube-system/coredns-787d4945fb-2w6pd:53 (ID:5870) dns-request proxy FORWARDED (DNS Query todobackend.default.svc.cluster.local. A)
Feb 23 14:00:49.410: default/todoui-55674959d8-xj6tp:38117 (ID:61266) <- kube-system/coredns-787d4945fb-2w6pd:53 (ID:5870) dns-response proxy FORWARDED (DNS Answer "10.101.227.123" TTL: 30 (Proxy todobackend.default.svc.cluster.local. A))
Feb 23 14:00:49.412: default/todoui-55674959d8-xj6tp:54380 (ID:61266) -> default/todobackend-749f77d9c5-tvk8j:8080 (ID:5175) http-request FORWARDED (HTTP/1.1 GET http://todobackend:8080/todos/)
Feb 23 14:00:49.415: default/todoui-55674959d8-xj6tp:54380 (ID:61266) <- default/todobackend-749f77d9c5-tvk8j:8080 (ID:5175) http-response FORWARDED (HTTP/1.1 200 3ms (GET http://todobackend:8080/todos/))
Feb 23 14:00:49.418: 10.0.3.251:56632 (world) <- default/todoui-55674959d8-xj6tp:8090 (ID:61266) http-response FORWARDED (HTTP/1.1 200 10ms (GET http://10.107.11.6:8090/))
So yes, the curl loop from the separate command window can be traced:
- line 1: a GET on / reaches the todoui pod via its service running on 10.107.11.6
- lines 2 + 3: this pod queries DNS for the todobackend service and receives a response
- lines 4 + 5: this todoui pod sends a GET on /todos/ to the todobackend pod and receives a response with status 200
- line 6: the todoui pod sends a response with status 200 back to curl
Thus so far so good: thanks to the power of eBPF Cilium is able to gain insight into my traffic without having to deploy any sidecar proxies.
Overhead
Without any sidecar proxies it appears there is no overhead associated per pod. However, even if I cannot see it, the additional data gathering takes effort.
Due to the efficiency of eBPF this overhead remains low, though, allowing Cilium to provide great network performance as shown in a CNI benchmark when running such a sidecarless model.
Of course there remains the control plane as well as the various helper applications:
$ kubectl top po --namespace kube-system | grep -e NAME -e cilium -e hubble; kubectl top po --namespace cilium-monitoring
NAME                               CPU(cores)   MEMORY(bytes)
cilium-fbkrr                       10m          343Mi
cilium-l2pj4                       5m           318Mi
cilium-operator-887755954-nqd9j    1m           21Mi
cilium-xdz2m                       5m           310Mi
cilium-zl9fn                       5m           309Mi
hubble-relay-745fd8bff5-j4r9f      1m           16Mi
hubble-ui-55b967c7d6-4jmmc         1m           49Mi
NAME                          CPU(cores)   MEMORY(bytes)
grafana-698bbd89d5-t2rxz      2m           29Mi
prometheus-75fd6464d8-jkxtl   6m           420Mi
Access the Hubble UI
I might prefer a different interface for accessing all these data on the fly. For that I can easily utilize the Hubble UI, i.e. a web interface.
So I’ll open a port-forwarding to this service:
$ kubectl port-forward -n kube-system svc/hubble-ui 8081:80
Now I will be able to access this through my local browser at http://localhost:8081/, where I then can select the “default” namespace for viewing, and I will see the application like in the following picture:
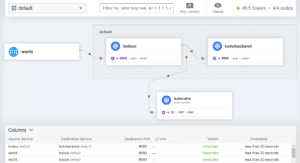 />
/>
So all I could query via CLI I will find here as well.
And yes, there also exists a cilium hubble ui command, but the above way via kubectl could be used even if the cilium binary were not available locally, hence the mention.
Traffic shaping
Now that I have made use of some basic functionality commonly provided by a Service Mesh, i.e. network observability, I’d like to start steering my traffic. That is, I will lock down access to the UI of my sample application, and in doing so go beyond what is already easily possible using standard Network Policies.
Apply a Cilium Network Policy
That UI component has a certain flaw intentionally built in: calls to a “/stress/” endpoint will cause just that, i.e. the component will uselessly burn some CPU cycles. For demonstrating that I can cancel the while loop from above and issue in the same command windows:
$ time curl --silent --max-time 10 "$LOADBALANCER_IP:8090/stress/"

real    0m3.700s
user    0m0.006s
sys     0m0.000s
This access can then be seen in Hubble:
Feb 23 14:56:46.076: 10.0.3.123:54860 (world) -> default/todoui-55674959d8-xj6tp:8090 (ID:61266) http-request FORWARDED (HTTP/1.1 GET http://10.107.11.6:8090/stress/)
Feb 23 14:56:49.770: 10.0.3.123:54860 (world) <- default/todoui-55674959d8-xj6tp:8090 (ID:61266) http-response FORWARDED (HTTP/1.1 302 3693ms (GET http://10.107.11.6:8090/stress/))
So the request was indeed served, but it took about 3.7 seconds.
Now I want to lock down access to my UI component to prevent abusing this “/stress/” endpoint. So I apply a L7-aware CiliumNetworkPolicy as follows:
apiVersion: "cilium.io/v2"
kind: CiliumNetworkPolicy
metadata:
  name: "lock-down-todoui"
spec:
  description: "Allow only to GET / on todoui"
  endpointSelector:
    matchLabels:
      app: todoui
  ingress:
  - toPorts:
    - ports:
      - port: "8090"
        protocol: TCP
      rules:
        http:
        - method: "GET"
          path: "/"
If I now retry my access from above I see a different result:
$ time curl --silent --max-time 10 "$LOADBALANCER_IP:8090/stress/"
Access denied

real    0m0.007s
user    0m0.000s
sys     0m0.005s
“Access denied”, huh! And this represented by Hubble as follows:
Feb 23 15:02:13.181: 10.0.3.123:35654 (world) -> default/todoui-55674959d8-xj6tp:8090 (ID:61266) http-request DROPPED (HTTP/1.1 GET http://10.107.11.6:8090/stress/)
So the request was intercepted by Cilium and then just “DROPPED”. For once I start applying a CiliumNetworkPolicy to a resource only what is explicitly whitelisted will be allowed and everything else will be denied.
Of course I will have widely crippled my UI component if all I allow to access is “/” via get, so I’d have to add paths and methods as specifically required by my application, e.g. also allowing POST on “/” etc. in the rules.http of my CiliumNetworkPolicy.
But this example serves to illustrate one feature I have gained by deploying Cilium into my cluster, just to give a taste of what is possible.
Reality check and further outlook
Gaining insight into my in-cluster network without having to deploy sidecar proxies along my containers does have its appeal. But I must not forget that even though I don’t see some of the complexity involved anymore, it is still present, albeit handled at a different place.
For instance, the eBPF programs injected into the kernel for the purposes of the Cilium Service Mesh bear heavy load, and they should never fail or malfunction as that might jeopardize the overall system stability. Owing to this consideration at the moment all eBPF programs are limited in size to one million instructions; CPU instructions, that is, and not lines of code. And before loading such a program the verifier component will need to evaluate all possible program states and branches, making it all too easy to reach this complexity limit.
As such, what can be done with eBPF programs is limited. And furthermore, observing and debugging these programs at runtime poses a considerable challenge, too.
Due to this Cilium still relies on userspace components in addition to eBPF programs doing much heavy lifting. These components don’t need to be deployed per pod anymore as with classic Service Meshes, but still per cluster node running as per-host proxies, thus somewhat obliterating the previously given clear separation between individual workloads when now Service Mesh logic is handled intermingled on the cluster host. This leads to a perception of less workload isolation, combined with a potential higher blast radius in case of any problems.
Also as of now Cilium does not yet offer some of the advanced features or easy configuration thereof as I could find with some of the more established Service Meshes like Istio. Among these are full mTLS, network retries and timeouts, and fault or delay injection. The newly released Cilium 1.13 addresses this concern to a great deal, but it still remains to be evaluated.
Conclusion
Cilium provides a very welcome additional option in the field of Service Meshes, with its sidecar-less model. In its current form it already readily provides the basics one would expect from a Service Mesh, and more, such as:
- cluster-internal network observability
- cluster-internal traffic control
In doing so, Cilium remains rather resource-efficient due to building on top of eBPF, so if a Service Mesh is needed and its feature set suffices Cilium will be a good choice.
Get in touch with us via mail – info@novatec-gmbh.de !