This is one in a small series of blog posts about Kubernetes Service Meshes, please check there for reference. While the previous post started out by introducing the general picture and the basic concepts, here I will deal with a specific implementation and its respective details.
All contents presented here will be covered in more detail as part of the Novatec training “Docker und Kubernetes in der Praxis”. And of course all shown technologies have more features than merely those presented here, where I will only provide a glimpse into them.
Linkerd
Linkerd is fully open source, licensed under Apache License 2.0, and is a Cloud Native Computing Foundation incubating project. Linkerd is the very first Service Mesh project and the project that gave birth to the term service mesh itself, cf. The Service Mesh: What Every Software Engineer Needs to Know about the World’s Most Over-Hyped Technology, and it is developed in the open in the Linkerd GitHub organization.
Buoyant, the original creators of Linkerd, offer support, training, and enterprise products around the open-source Linkerd tool.
Linkerd has three basic components: a data plane (with proxies written in Rust and specialized for Linkerd in order to be as small, lightweight, and safe as possible), a control plane, and a UI. One runs Linkerd by:
- Installing the CLI on a local system
- Installing the control plane into a cluster (any cluster will do as long as I have sufficient permissions, even tiny local ones running via Minikube or KinD)
- Addin workloads to Linkerd’s data plane
Once a service is running with Linkerd, one can use Linkerd’s UI to inspect and manipulate it.
Installation
CLI
As per Linkerd | Getting Started I can download the CLI directly. At the time of this writing this is version 2.12.4 and thus
$ curl --silent --location https://github.com/linkerd/linkerd2/releases/download/stable-2.12.4/linkerd2-cli-stable-2.12.4-linux-amd64 --output $HOME/bin/linkerd
$ chmod +x $HOME/bin/linkerd
will serve to install the CLI to my local system.
Cluster
Using this CLI I can then deploy the linkerd components into my cluster just as per Linkerd | Getting Started and Linkerd | Using extensions:
$ linkerd check --pre
$ linkerd install --crds | kubectl apply -f -
$ linkerd install | kubectl apply -f -
$ linkerd viz install | kubectl apply -f -
$ linkerd check
The various check commands only serve to first ensure my cluster fulfills the requirements and the later installation went as expected. Make sure to execute them to see what has been checked and deployed – even though you might not understand the full output right now.
Please note that there are instructions for Linkerd | Installing Linkerd with Helm, but I’d need to provide certificates by myself, so I’ll stick to using linkerd install.
Integrate workloads
Now that the Linkerd control plane is running in my cluster I can start integrating workloads. For that I can simply mark a namespace for auto-injection of the data plane sidecar proxies via a specific annotation:
$ kubectl annotate namespace default linkerd.io/inject=enabled # or any other namespace instead of "default"
This will ensure that any future deployments to this namespace will be handled by Linkerd. And if I already have any deployments in this namespace I could simply trigger their integration via
$ kubectl get deployments -o yaml | linkerd inject - | kubectl apply -f -
I will now deploy two sample applications that together build a simple todo list. First a backend:
apiVersion: apps/v1
kind: Deployment
metadata:
  name: todobackend
spec:
  replicas: 1
  selector:
    matchLabels:
      app: todobackend
  template:
    metadata:
      name: todobackend
      labels:
        app: todobackend
    spec:
      containers:
      - name: todobackend
        env:
        - name: SPRING_PROFILES_ACTIVE
          value: dev
        image: novatec/technologyconsulting-containerexerciseapp-todobackend:v0.1
      restartPolicy: Always
---
apiVersion: v1
kind: Service
metadata:
  name: todobackend
spec:
  type: ClusterIP
  ports:
  - port: 8080
  selector:
    app: todobackend
And then a frontend:
apiVersion: apps/v1
kind: Deployment
metadata:
  name: todoui
spec:
  replicas: 1
  selector:
    matchLabels:
      app: todoui
  template:
    metadata:
      name: todoui
      labels:
        app: todoui
    spec:
      containers:
      - name: todoui
        image: novatec/technologyconsulting-containerexerciseapp-todoui:v0.1
      restartPolicy: Always
---
apiVersion: v1
kind: Service
metadata:
  name: todoui
spec:
  type: LoadBalancer
  ports:
  - port: 8090
  selector:
    app: todoui
Examine the meshed workloads
When I now examine the newly-deployed workloads I can see what Linkerd has automatically added:
$ kubectl get po
NAME                           READY   STATUS    RESTARTS   AGE
todobackend-5cb4966b77-72q99   2/2     Running   0          1m39s
todoui-65fbdcb8c5-qbk8n        2/2     Running   0          1m30s
Please note that each pod now consists of two containers, even though only a single one was defined above. Let’s inspect those a bit to take a look under the hood:
$ kubectl describe pod todoui-65fbdcb8c5-qbk8n [...] Init Containers: linkerd-init: [...] Containers: todoui: [...] linkerd-proxy: [...] [...]
and also
$ kubectl logs todoui-65fbdcb8c5-qbk8n linkerd-init
[...]
time="2023-02-21T07:51:32Z" level=info msg="/sbin/iptables -t nat -N PROXY_INIT_REDIRECT -m comment --comment proxy-init/redirect-common-chain/1676965892"
[...]
time="2023-02-21T07:51:32Z" level=info msg="/sbin/iptables -t nat -N PROXY_INIT_OUTPUT -m comment --comment proxy-init/redirect-common-chain/1676965892"
[...]
time="2023-02-21T07:51:32Z" level=info msg="/sbin/iptables -t nat -A OUTPUT -j PROXY_INIT_OUTPUT -m comment --comment proxy-init/install-proxy-init-output/1676965892"
[...]
as well as
$ kubectl logs todoui-65fbdcb8c5-qbk8n linkerd-proxy
[     0.004141s]  INFO ThreadId(01) linkerd2_proxy::rt: Using single-threaded proxy runtime
[     0.008156s]  INFO ThreadId(01) linkerd2_proxy: Admin interface on 0.0.0.0:4191
[     0.008246s]  INFO ThreadId(01) linkerd2_proxy: Inbound interface on 0.0.0.0:4143
[     0.008248s]  INFO ThreadId(01) linkerd2_proxy: Outbound interface on 127.0.0.1:4140
[     0.008249s]  INFO ThreadId(01) linkerd2_proxy: Tap interface on 0.0.0.0:4190
[     0.008250s]  INFO ThreadId(01) linkerd2_proxy: Local identity is default.default.serviceaccount.identity.linkerd.cluster.local
[     0.008251s]  INFO ThreadId(01) linkerd2_proxy: Identity verified via linkerd-identity-headless.linkerd.svc.cluster.local:8080 (linkerd-identity.linkerd.serviceaccount.identity.linkerd.
cluster.local)
[     0.008252s]  INFO ThreadId(01) linkerd2_proxy: Destinations resolved via linkerd-dst-headless.linkerd.svc.cluster.local:8086 (linkerd-destination.linkerd.serviceaccount.identity.linker
d.cluster.local)
[     0.016121s]  INFO ThreadId(02) daemon:identity: linkerd_app: Certified identity id=default.default.serviceaccount.identity.linkerd.cluster.local
So, not only did the pod receive an additional container in which the linkerd-proxy runs, but there was also an init container executed before any other containers were started that merely took care of redirecting all traffic to the linkerd-proxy container. Neat.
Feel free to check the full command output, of course. I have redacted the output somewhat to pinpoint some specific parts, but you will see that Linkerd has added quite some additional information altogether.
Overhead
Of course, this comes at a certain price per pod for the data plane proxy, check e.g.
$ kubectl top pod todoui-65fbdcb8c5-qbk8n --containers
POD                       NAME            CPU(cores)   MEMORY(bytes)
todoui-65fbdcb8c5-qbk8n   linkerd-proxy   1m           12Mi
todoui-65fbdcb8c5-qbk8n   todoui          2m           535Mi
12Mi RAM and some CPU cycles already, and without handling any real work at the moment. Once real work starts the overhead can get quite high as shown in benchmarks. But of course there is also the control plane as well as the various helper applications:
$ kubectl top pod --namespace linkerd; kubectl top pod --namespace linkerd-viz
NAME                                      CPU(cores)   MEMORY(bytes)
linkerd-destination-78fdc47d4b-v7hm7      3m           143Mi
linkerd-identity-5654c57cd4-bkpzb         1m           47Mi
linkerd-proxy-injector-744546df5c-4j65h   1m           53Mi
NAME                            CPU(cores)   MEMORY(bytes)
metrics-api-58878cc567-ms48c    1m           49Mi
prometheus-947f685c4-ccmz6      6m           158Mi
tap-d7968f4d8-wdqqq             2m           57Mi
tap-injector-7cf97465df-xx8w6   1m           50Mi
web-848748b777-974g2            1m           42Mi
Investigate network traffic metrics
First let’s put some load on the deployed and meshed todo app, so I execute in a separate command window:
LOADBALANCER_IP="$(kubectl get svc todoui -o jsonpath="{.status.loadBalancer.ingress[0].ip}")"
while sleep 2; do
    curl --silent "http://$LOADBALANCER_IP:8090" | head -n 4
done
Of course feel free to also access the todo app frontend pointing your browser of choice at that URL. What does Linkerd know about this traffic now? For my deployments:
$ linkerd viz stat deployments
NAME          MESHED   SUCCESS      RPS   LATENCY_P50   LATENCY_P95   LATENCY_P99   TCP_CONN
todobackend      1/1   100.00%   0.8rps           1ms           4ms           4ms          3
todoui           1/1   100.00%   0.8rps           6ms          16ms          19ms          2
So all my deployments are meshed (i.e. have the linkerd-proxies added to them), and I see the so-called golden metrics (per default for the past minute):
- success rate of requests (i.e. ratio of non-4XX and non-5XX requests)
- requests per second
- latency percentiles
There are various filtering options available, just check linkerd viz stat.
And now for specific Pods in our namespace, filtered by connections to a specific Service:
$ linkerd viz stat pods --to service/todobackend
NAME                       STATUS   MESHED   SUCCESS      RPS   LATENCY_P50   LATENCY_P95   LATENCY_P99   TCP_CONN
todoui-65fbdcb8c5-qbk8n   Running      1/1   100.00%   0.5rps           2ms           2ms           2ms          1
Investigate requests
But what is actually going on in my namespace?
$ linkerd viz top deployments
(press q to quit)
(press a/LeftArrowKey to scroll left, d/RightArrowKey to scroll right)

Source                   Destination                   Method      Path      Count    Best   Worst    Last  Success Rate
todoui-65fbdcb8c5-qbk8n  todobackend-5cb4966b77-72q99  GET         /todos/      18     2ms     5ms     3ms       100.00%
10.244.0.1               todoui-65fbdcb8c5-qbk8n       GET         /             9     5ms     9ms     6ms       100.00%
More details can be retrieved by tap‘ing into a deployment:
$ linkerd viz tap deployments/todoui
req id=1:0 proxy=in  src=10.244.0.1:50803 dst=10.244.0.17:8090 tls=no_tls_from_remote :method=GET :authority=172.18.253.1:8090 :path=/
req id=1:1 proxy=out src=10.244.0.17:59136 dst=10.244.0.15:8080 tls=true :method=GET :authority=todobackend:8080 :path=/todos/
rsp id=1:1 proxy=out src=10.244.0.17:59136 dst=10.244.0.15:8080 tls=true :status=200 latency=2409µs
end id=1:1 proxy=out src=10.244.0.17:59136 dst=10.244.0.15:8080 tls=true duration=199µs response-length=17B
rsp id=1:0 proxy=in  src=10.244.0.1:50803 dst=10.244.0.17:8090 tls=no_tls_from_remote :status=200 latency=4797µs
end id=1:0 proxy=in  src=10.244.0.1:50803 dst=10.244.0.17:8090 tls=no_tls_from_remote duration=252µs response-length=2252B
^C
So yes, the curl loop from the separate command window can be traced:
- line 2: a curl GET on / reaches the todoui pod running on 10.244.0.17
- lines 3, 4, 5: this pod sends a GET on /todos/ to the todobackend pod running on 10.244.0.15 and receives a response with status 200
- lines 6, 7: the todoui pod sends a response with status 200 back to curl
And in addition to the various methods, paths and metrics Linkerd also indicates that the cluster-internal connection from todoui to todobackend is encrypted using mutual TLS (mTLS), i.e. with both sender and receiver using certificates to identify each other and to encrypt the communication – as handled by the sidecar proxies.
By the way, Linkerd readily reports the same when asked suitably:
$ linkerd viz edges deployments
SRC          DST           SRC_NS        DST_NS    SECURED
todoui       todobackend   default       default   √
prometheus   todobackend   linkerd-viz   default   √
prometheus   todoui        linkerd-viz   default   √
tap          todoui        linkerd-viz   default   √
In addition to the connection already observed above, also the connections from Linkerd’s Prometheus monitoring instance and from the tap interface which gathered the data from above are secured.
The initial connection to the LoadBalancer IP of the todoui service had not been encrypted, though, see the tls=no_tls_from_remote above. This is due to the Linkerd Service Mesh only handling cluster-internal connections. However, it is easily possible to secure external connections using an Ingress Controller and then also integrate this Ingress Controller into a Service Mesh, but that is out of scope for here now.
Access the Linkerd dashboard
I might prefer a different interface for accessing all these data on the fly. For that I can easily utilize the Linkerd dashboard, i.e. a web interface.
So I’ll open a port-forwarding to this service:
$ kubectl port-forward --namespace linkerd-viz service/web 8084
Now I will be able to access this through my local browser at http://localhost:8084/, and I will see the application like in the following pictures:
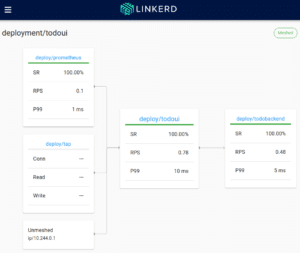
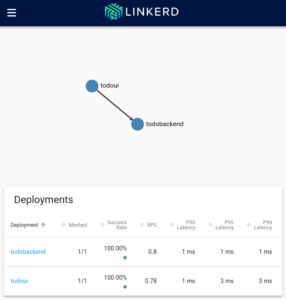
So all I could query via CLI I will find here as well.
And yes, there also exists a linkerd viz dashboard command, but the above way via kubectl could be used even if the linkerd binary were not available locally, hence the mention.
Further outlook
Of course, by the above only a rather limited subset of Linkerd’s features has been shown.
For instance, Linkerd’s traffic split functionality allows one to dynamically shift arbitrary portions of traffic destined for a Kubernetes service to a different destination service. This feature can be used to implement sophisticated rollout strategies such as canary deployments and blue/green deployments, for example, by slowly easing traffic off of an older version of a service and onto a newer version.
Check Traffic Split for further details.
Linkerd can also be configured to emit trace spans from the proxies with will then be collected via Jaeger, allowing one to see exactly what time requests and responses spend inside. However, distributed tracing requires more changes and configuration. Still, out of the box Linkerd already provides
- live service topology and dependency graphs
- aggregated service health, latencies, and request volumes
- aggregated path / route health, latencies, and request volumes
Check Distributed tracing with Linkerd for further details.
Conclusion
The Linkerd Service Mesh readily provides the basics one would expect from a Service Mesh, and more, such as:
- cluster-internal network observability
- fully-handled cluster-internal transfer encryption via mTLS
- cluster-internal traffic shaping
In doing so, Linkerd remains relatively resource-efficient, so if a Service Mesh is needed and its feature set suffices Linkerd will be a good choice.
Get in touch with us via mail – info@novatec-gmbh.de !